Confident decision-making
StatBun is a holistic reporting tool for combining and analysing data from sales, finance and HR, for example. See the big picture and filter views to get a more accurate picture to support your decisions. Make reporting and decision-making easier without unnecessary additional projects.
Real-time monitoring
Reports in seconds
Comprehensive and filtered views
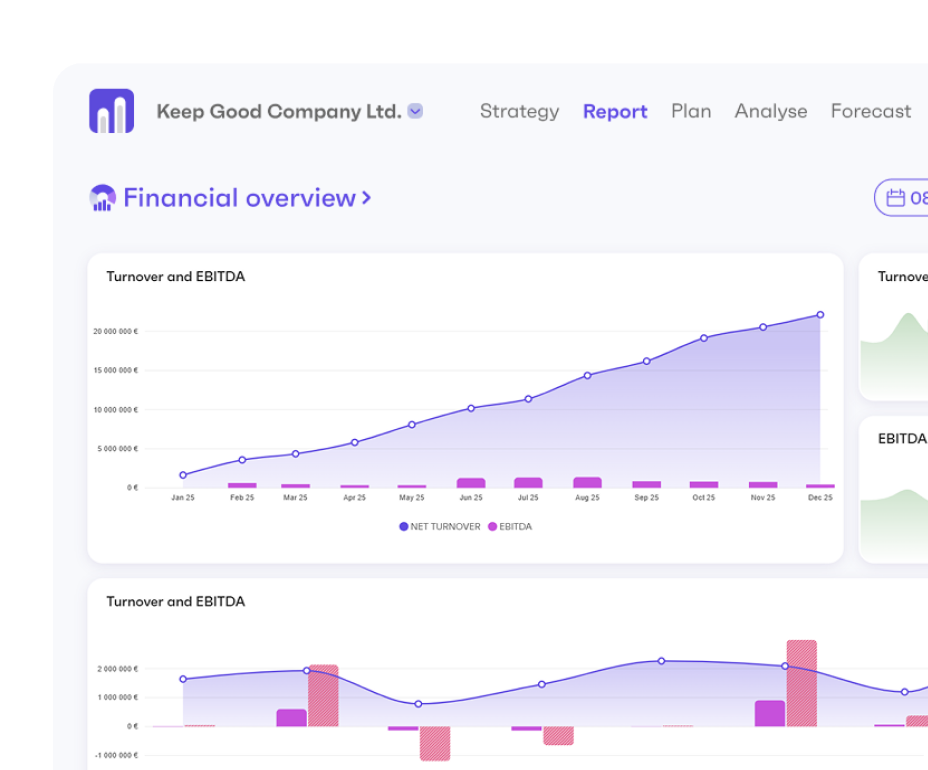
Intelligent financial reporting
StatBun makes your financial reporting smart, clear and easy.
Understand the state of your finances at a glance
Get clear insight into your finances in minutes, automatically. StatBun makes your data understandable and easy to interpret. You’ll see:
- A real-time view from business to economy
- Income statement drawings, balance sheet totals and cash flow statements
- Automated visual reports, without the need for multiple Excel files
- Ready-made integrations enable your automated reports in seconds
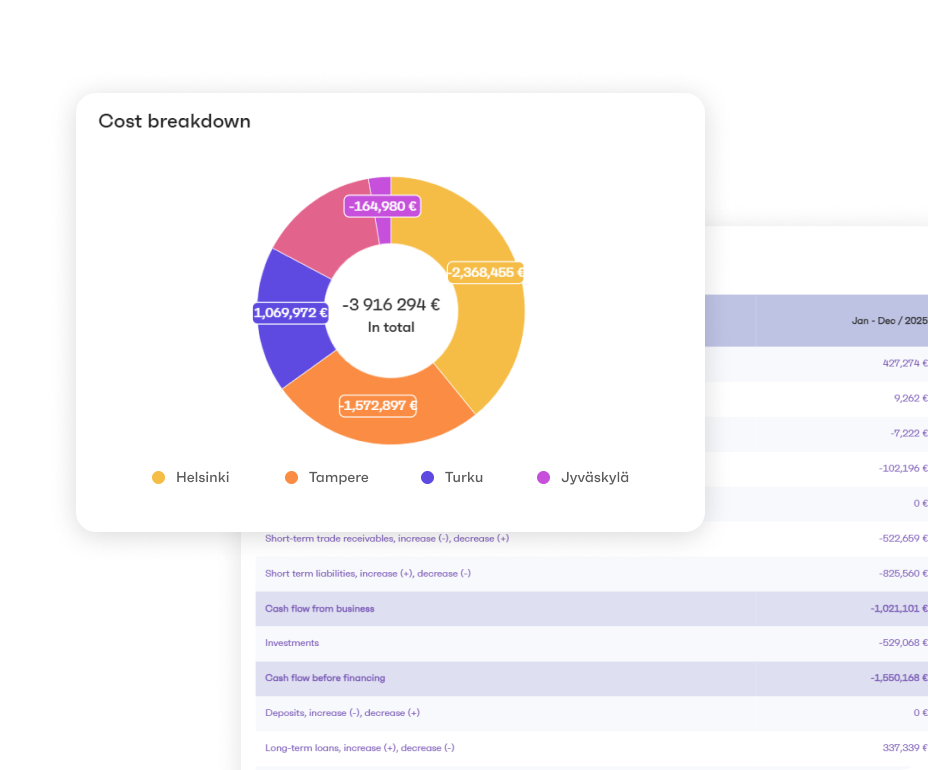
Go deeper and identify the key drivers of growth
Dive deeper and discover the real drivers of your business. StatBun helps you analyse, compare and understand why your numbers are changing.
- Drill down to the figures you want and see the figures by object of calculation. Access up to row level data if required.
- Cross-filter the data by different records and find correlations.
- Easily identify the key drivers of profitability and growth and understand the profitability of your business areas.
Better decisions through foresight
Look ahead with confidence. StatBun gives you the tools to forecast and make better decisions. StatBun gives you a clear direction for your business:
- Get forecasts and scenarios easily with ready-made options
- When the future is clear, you can react quickly. Choose the forecasting models you want and get multiple scenarios.
- StatBun provides data-driven decision making for management with different forecasting models. Forecasts can be made from the budget or from different ways of calculating actuals – or a combination of both.

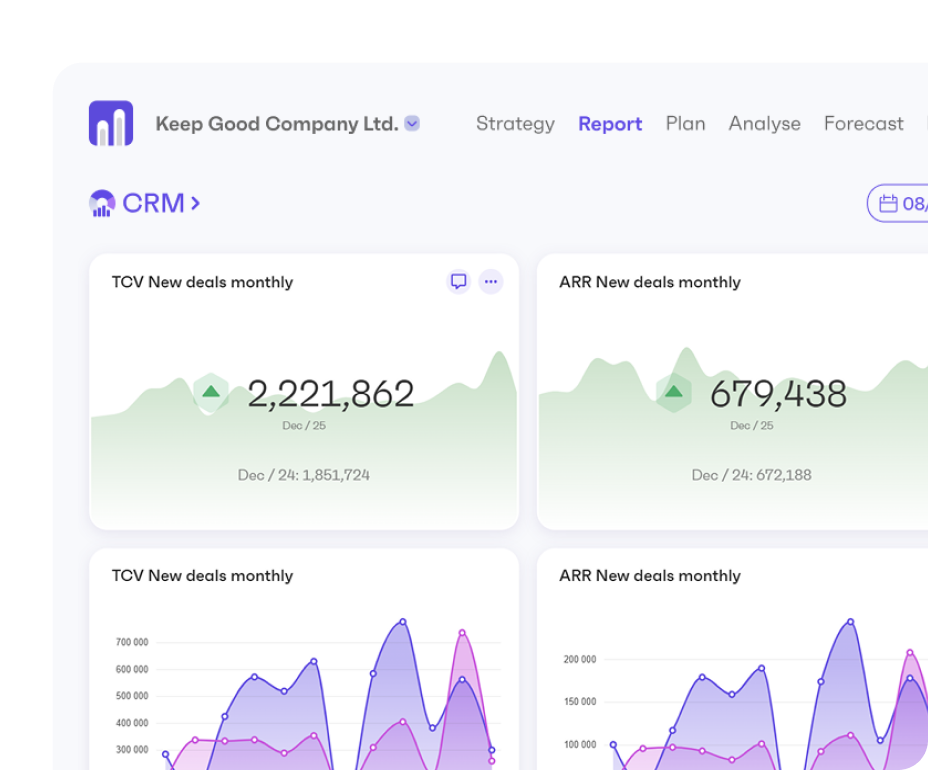
Proactive sales reporting
At a glance, you’ll see the pitfalls of the sales process and be able to react in time.
See every step of your sale and avoid the pitfalls
StatBun shows the entire sales pipeline in real time without manual reports. StatBun combines your data into clear, business-driven reporting. At a glance, you can see where deals are made and where they stop. You’ll see:
- MRR, ARR, one-time payment, and TCV meters
- Status and type of the sale
- Stages of the sales pipeline
Dive into your sales data
StatBun brings the store lines up to the reporting stage, allowing sales to be analysed with real accuracy. You can view sales by product, by customer or by vendor (not just at store level). Compare different timeframes and you’ll see:
- Amounts and number of shares traded
- For example, by product, by customer, by vendor
- Prices, discounts and one-off fees
- Drilling into the sales pipeline

Anticipate and react in time
StatBun makes your recurring turnover transparent and easy to predict. This helps management and sales to anticipate growth and make better decisions in a timely manner. You can forecast sales for the coming year with different forecasting options. You’ll see:
- Evolution of one-time payments, TCV, MRR and ARR over time and under different projection options
- Impact of contracts on future turnover
- Comparison between actual and expected sales

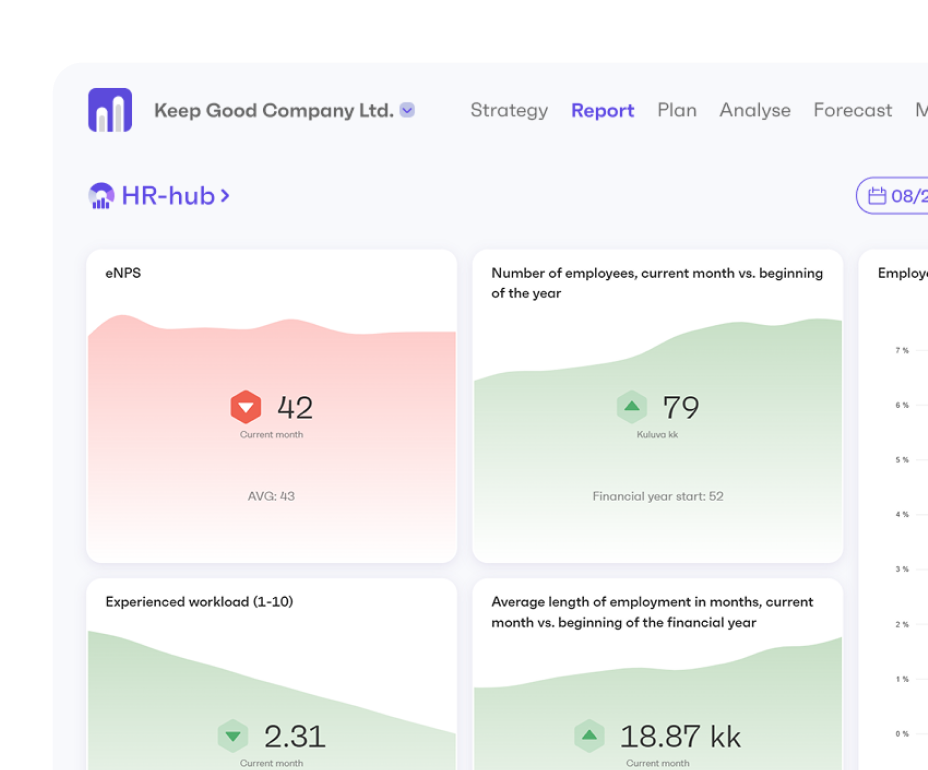
The most accurate HR reporting
Bring together staff, working time and salary data in one clear reporting view.
A complete picture of staff without manual work
StatBun HR brings together personnel, working time and salary data in one clear reporting view. You get an up-to-date and reliable overview without manual aggregation – directly supporting your decision-making. You’ll see for example:
- Number of employees and man-years
- Figures by age, gender, type of employment, etc.
- Completed HR reports for the board, management and front-line staff
Analyse your staff from just the right perspective
StatBun HR’s filtering of timesheet reporting makes visible:
- Hours worked and working time records
- Types of working time (e.g. normal work, overtime)
- Absences: annual leave, unpaid leave and sick leave
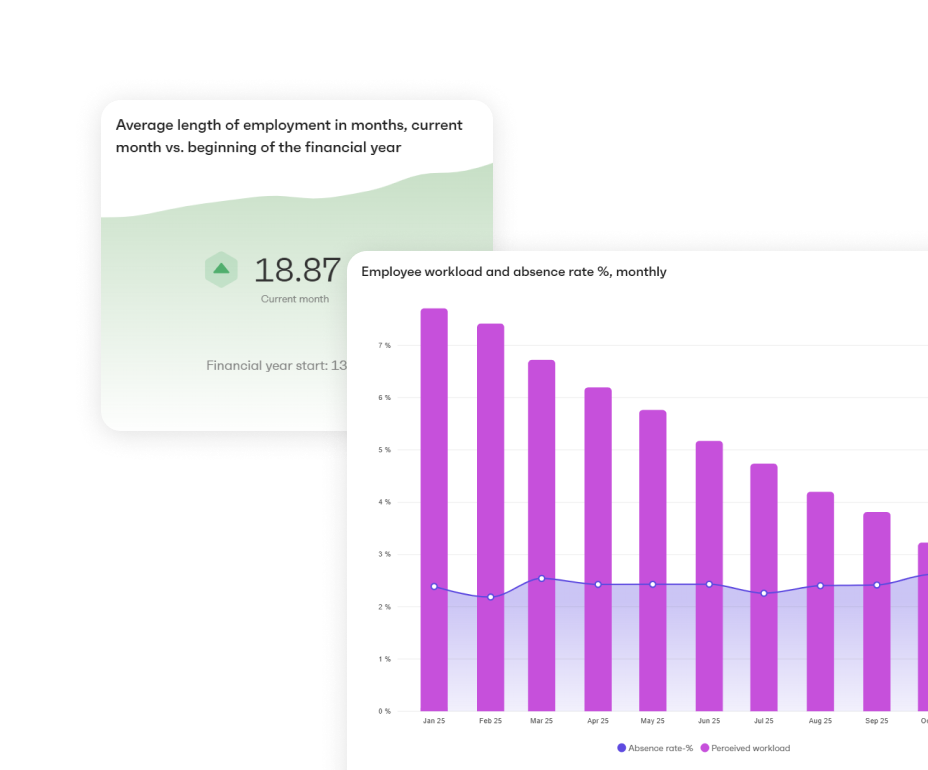
Identify the impact on your business
Look at working time from different perspectives and identify the impact of workload, resource use and absences on business. Review working hours and absences:
- By employee
- By cost centre and project
- By title and occupational group
- By form, type and nature of employment relationship

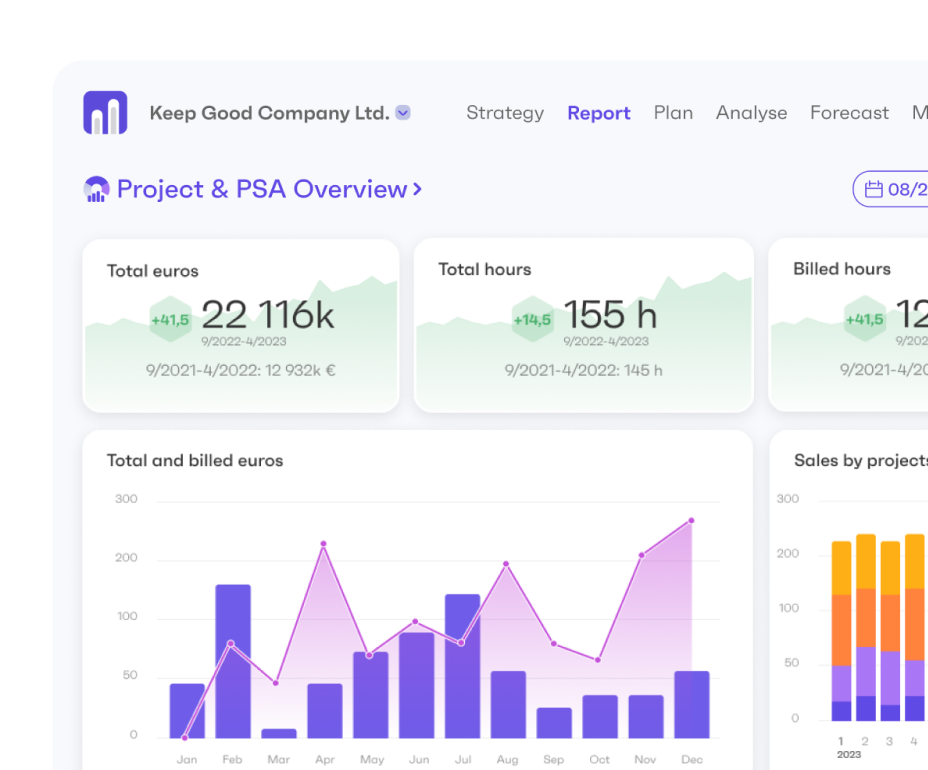
Understanding PSA
Review the profitability of projects on a billing and hourly basis.
See the overall status of your projects
Get full visibility of your project status. StatBun brings together fragmented project data so you know where you stand. No more excel sheets or bad reports from accounting tools. You’ll see:
- A single view of project profitability
- Billing, costs and margin
- An up-to-date overview of all projects
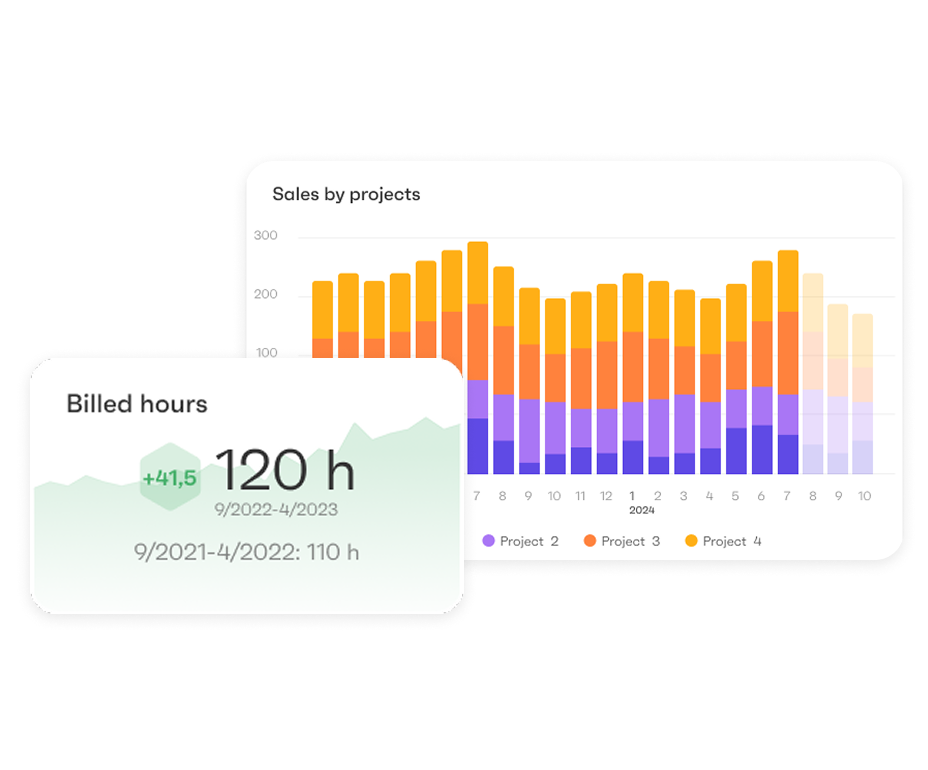
Deepen your understanding of profitability
Analyse the effectiveness of your project activities and identify areas for improvement. StatBun helps you understand the profitability of your projects at the root level. You’ll immediately see what’s eating into your project margins. You’ll see:
- Analysis of resource utilisation and efficiency
- Project-specific margin monitoring and comparisons
- Budget overruns, excessive delays and risky projects
Steer the direction of your projects with foresight
Take every step of your project into your own hands. StatBun provides the tools to plan capacity and ensure future profitability. You can make forecasts using the planning tool or based on actuals. StatBun enables you to:
- Projections of project revenues and resources
- Capacity planning and bottlenecks
- Better pricing of projects with data

Find out more about the reporting features:
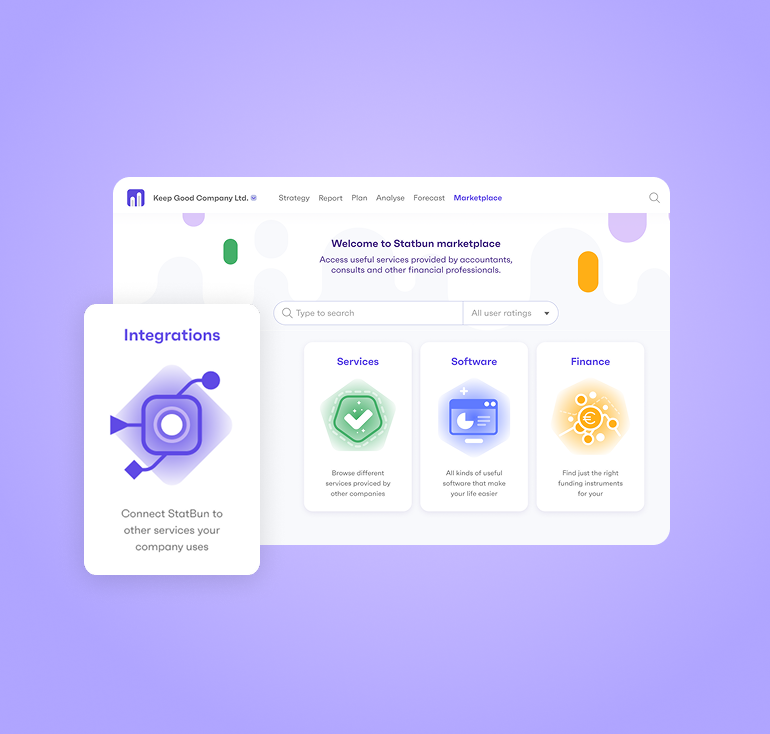
Connect all your data to
StatBun
StatBun integrates everywhere! Connect StatBun to your finance, HR, sales or marketing software with the click of a button using our ready-made integrations. If an integration is missing, we’ll take care of it for you.


What is your role?
Facilitate collaboration and get information circulating within your company or sharing it with external stakeholders. StatBun’s role-based approach makes your everyday life easier.